MARKET UPDATE MAY 19, 2023
SUMMARY
The Fed raised rates by another 25 bps in their policy announcement last week, which the market mostly took in stride as the increase was expected. (Yes, that is the same opening sentence from our last Market Update written in March.) Growth stocks outperforming Value stocks has been a major theme year-to-date. To wit: the Nasdaq 100 is up over +22%, while the Dow Jones Industrial Average (DJIA) is only up slightly more than +1.0%. Interestingly enough, the Nasdaq is still down roughly -20% from its previous highs seen in November 2021, while the DJIA is down roughly half of that. While the Nasdaq’s move higher this year has been significant, it is technically still in a bear market. Evidence is mounting that the current uptrend, starting in October of last year, may be more sustainable over a longer-term period.
BROAD MARKET PERFORMANCE (AS OF 5/15/2023)
| YTD Performance | Trailing 1-Year Performance | |
|---|---|---|
| SPY (SPDR S&P 500 ETF) | 8.41% | 4.57% |
| DIA (SPDR DJIA ETF) | 1.31% | 5.71% |
| QQQ (Nasdaq 100 ETF) | 22.91% | 9.06% |
| TLT (20+ Year US Treasury ETF) | 4.70% | -8.57% |
| AGG (US Agg Bond ETF) | 3.23% | -0.69% |
| Table 1: Source: Morningstar | ||
MACROECONOMIC VIEW
The Fed has now raised its target fed funds rate by +500bps since the beginning of last year to combat the high levels of inflation we have seen following the government’s fiscal response to the Covid pandemic. The rate increases have been a historic policy response (the fastest rate hike cycle in history) to combat the previous historic policy moves (the largest fiscal spending programs in history). In our view, we are still in the early innings of feeling the ramifications ripple through the economy. How long it’s going to take for inflation to come back down to target levels is yet to be seen, though we believe it will take time. We have been writing about how the NDR Inflation Timing model peaked in June 2022, providing the first signs that inflation had likely peaked. Currently, the model’s message is that there are strong disinflationary pressures in play. How quickly inflation can come back to the Fed’s two percent target is the question on investors’ minds, and as those expectations shift, increased volatility will likely result.
One of the main contributing factors to the inflation problem was the Fed’s monetary response to Covid. They increased the absolute level of U.S. Government debt by more than +30%. Consequently, from February 2020 to June 2022 we saw the M2 money supply increase by +40% as those stimulus packages made their way into the economy. To put that into context, during the ten years leading up to 2020, the average trailing-twelve-month M2 growth rate was slightly less than +6%.
While the Fed’s restrictive policies have been taking hold and money supply growth is now negative (seen in the bottom clip of Figure 1 below), the amount of supply that is still in the system is much higher than the pre-pandemic trend of +6% yearly growth (middle clip in Figure 1 below). This is why we believe inflation is going to be stickier than the market is expecting, and the Fed may keep rates higher for longer, as they have been indicating. Our view is that unless there is another disruptive credit event, the Fed is likely to hold rates higher for longer.
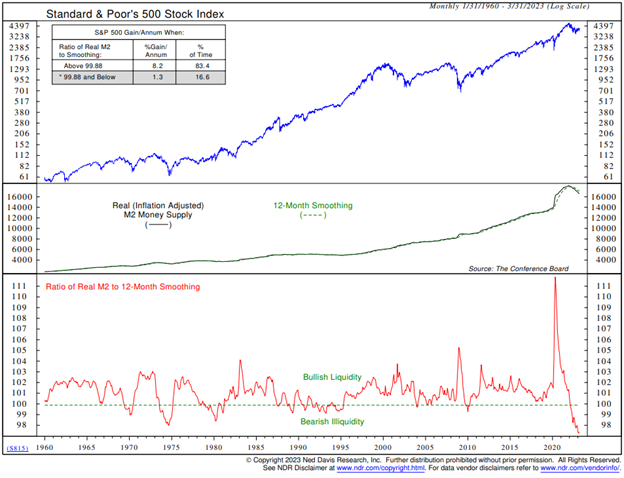
Figure 1: NDR Real (Inflation-adjusted) M2 Money Supply
In his May Market Minutes, Dave McGarel, First Trust’s Chief Investment Officer, made the interesting observation that “If we avoid a recession, will the Federal Reserve (Fed) cut rates significantly and quickly? Probably not. Will inflation get to the Fed’s 2% goal without a recession and higher unemployment? Unlikely. So, in our view, a soft landing would mean a tougher inflation fight and higher rates for longer, even if the Fed pauses for a while. Not great news for stocks nor a recipe for high earnings growth. Meanwhile, we believe a recession would probably trigger the Fed to move faster to cut rates. However, we’d expect that the economic impact of a recession would certainly affect earnings more negatively than a soft landing. Unemployment would likely increase. Not exactly good for stocks either.”
One way the restrictive monetary policy is affecting the economy is through banks’ willingness, or lack thereof, to lend. In the latest Senior Loan Officer Opinion Survey on bank lending (SLOOS), respondents indicated that, over the past three months, they had seen tighter standards and weaker demand for both business and personal loans. In fact, we are now at levels that have historically been seen during recessions within the business loan market.

Figure 2: Bank Lending Practices to Businesses
VALUATIONS
The S&P 500’s (large-cap stocks) valuation remains near levels that have historically indicated “fair value” based on forward earnings estimates. To us, this means there are still opportunities to buy quality companies at attractive valuations. Interestingly enough, the spread between “growth” and “value” multiples remained wide even with value’s outperformance last year. Currently, the average forward P/E for growth stocks is 27.1X, versus their historical median of 22.7X, while the average forward P/E of value stocks is 11.6X, which is well below their historical average of 13.8X. Clearly, value stocks offer a better opportunity for a “margin of safety.” We continue to focus on companies that tend to fall into the Value category but also own Growth stocks that meet our standards for generating large amounts of free cash flow, carry relatively low and manageable levels of debt, and have returns on capital above their cost of capital. These measures of quality will be even more valuable should we continue along the current path of weak earnings growth and a higher-than-normal interest rate environment.
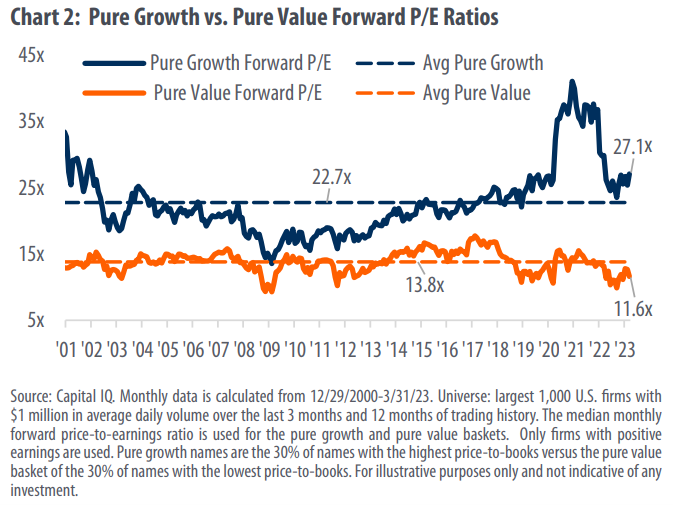
Figure 3: Pure Growth vs. Pure Value Forward P/E Ratios
TECHNICALS/SENTIMENT
The market (S&P 500) continues to trade within a range of 3,800 to 4,200, which we have seen for much of the last six months. As Art Huprich, our Chief Market Technician, put it in his latest Tech Talk, “A trading range, within a trading range, within a trading range—purgatory.” The Day Hagan Catastrophic Stop Model’s Internal (Technical) component continues to show a strong reading of 78.6 (above 45 is a buy), with six of the seven indicators being bullish. Our sentiment indicators are showing that investors are neither overly optimistic nor pessimistic currently.
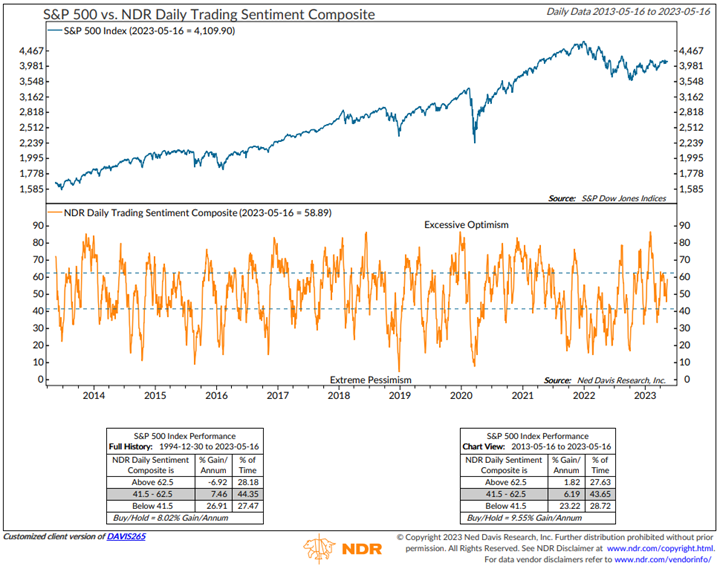
Figure 4: NDR Daily Trading Sentiment Composite
Overall, while this year can be summarized so far by “Growth” outperforming “Value,” the Nasdaq remains in bear market territory. The Fed raised rates in an unprecedented manner last year, and those effects are just now starting to ripple through the real economy. We are seeing liquidity dry up as banks are much less willing to lend, and the Fed is doing everything in its power to bring the money supply (M2) down. This process could take longer than most investors expect, given the +40% increase in M2 in just two years. While these factors have historically been headwinds for markets and the economy, it doesn’t necessarily mean that we will see a significant pullback in the equity markets. We continue to focus on companies generating high levels of free cash with high-quality balance sheets, as they have historically had higher probabilities of success in a slow earnings growth environment. Our Catastrophic Stop model supports this thesis as it remains bullish, but we will be quick to decrease equity exposure should the banking turmoil worsen and our models turn bearish.
In the meantime, please don’t hesitate to reach out if you have any questions.
Have a great week,
Regan Teague, CFA®, CFP®
Senior Investment Officer & Financial Advisor
Day Hagan Private Wealth
—Written 5.17.2023
Natalie Brown, CFP®, Director of Client Services
Don Hagan, CFA®, Partner, Chief Investment Strategist
Art Day, Partner, Senior Portfolio Manager
Print PDF Copy of the Article: Day Hagan Private Wealth Market Update: Market Update May 19, 2023 (pdf)
Disclosure: The data and analysis contained herein are provided “as is” and without warranty of any kind, either express or implied. Day Hagan Private Wealth (DHPW), any of its affiliates or employees, or any third-party data provider, shall not have any liability for any loss sustained by anyone who has relied on the information contained in any Day Hagan Private Wealth literature or marketing materials. All opinions expressed herein are subject to change without notice, and you should always obtain current information and perform due diligence before investing. DHPW accounts that DHPW or its affiliated companies manage, or their respective shareholders, directors, officers and/or employees, may have long or short positions in the securities discussed herein and may purchase or sell such securities without notice. The securities mentioned in this document may not be eligible for sale in some states or countries, nor be suitable for all types of investors; their value and income they produce may fluctuate and/or be adversely affected by exchange rates, interest rates or other factors.
Investment advisory services offered through Donald L. Hagan, LLC, a SEC registered investment advisory firm. Accounts held at Raymond James and Associates, Inc. (member FINRA, SIPC) and Charles Schwab & Co., Inc. (member FINRA, SIPC). Day Hagan Asset Management and Day Hagan Private Wealth are both dbas of Donald L. Hagan, LLC.