MARKET UPDATE JANUARY 10, 2024
SUMMARY
Last year saw equity markets climb a wall of worry as most major equity indexes saw double-digit growth despite the majority of pundits calling for a recession during the year. Our models started getting bullish in October 2022 and remained that way for much of 2023. After the robust rally we saw in the fourth quarter, our sentiment models indicate that market participants may be overly optimistic. This environment can correct itself through pullbacks or sideways consolidation. Currently, our technical indicators point to the latter. That said, should things deteriorate, we will be quick to reduce risks. Also, we would like to remind everyone that the beginning of the new year is a great excuse to reassess your financial plans or to begin the financial planning process if you never have.
BROAD MARKET PERFORMANCE (AS OF 12/31/2023)
| YTD Performance | Trailing 1-Year Performance | |
|---|---|---|
| SPY (SPDR S&P 500 ETF) | 26.19% | 26.19% |
| DIA (SPDR DJIA ETF) | 16.03% | 16.03% |
| QQQ (Nasdaq 100 ETF) | 54.85% | 54.85% |
| TLT (20+ Year US Treasury ETF) | 2.77% | 2.77% |
| AGG (US Agg Bond ETF) | 5.65% | 5.65% |
| Table 1: Source: Morningstar | ||
THE PAST YEAR IN REVIEW
As we turn the page to a new year and reflect on the past, it’s interesting to see how the equity markets climbed the “wall of worry” in 2023. If you remember, in 2022, the S&P 500 was down roughly 18%, while the price of the 10-year Treasury bond was down by roughly 17.8% as interest rates spiked higher. The Fed was still in the midst of its fight against inflation, and nearly EVERYONE on Wall Street was calling for a recession. In fact, the AAII (American Association of Individual Investors) Sentiment Poll logged 40 consecutive weeks of bears outnumbering the bulls, which was the longest negative streak in history.
Figure 1: AAII Sentiment Poll
Another measure of sentiment, the University of Michigan Consumer Sentiment Index, also recorded a record eight-straight months in negative territory as high prices and inflation hung over consumers’ heads like rain clouds.
Figure 2: University of Michigan Consumer Sentiment Index
Main Street did not fare much better in 2022, as we saw S&P 500 earnings (reported EPS) decline -27% year over year in the fourth quarter as the higher input costs (inflation at the wholesale level) put pressure on margins. We also saw the failure of Silicon Valley Bank (SVB) start the Regional Bank Crisis chain reaction. Although it feels like a lifetime ago, the first half of 2023 saw the largest bank failures in history, as the $548 Billion in total assets dwarfed the 2008 crisis by $175 billion.
Figure 3: S&P 500 As Reported (GAAP) EPS Growth (YoY%)
During 2023, even with the aforementioned negative news, equity markets marched higher for most of January and the first part of February before pulling back in the face of the eventual SVB failure. The Fed stepped in to save the day, which gave investors an all-clear signal and sparked the rally we saw for much of the second quarter. After a slight pullback in the third quarter, markets reset to begin their extremely resilient fourth quarter march higher into the end of the year. Interestingly enough, although most analysts on Wall Street were calling for a recession and continued negative equity performance in 2023, our models picked up that the pessimism surrounding equity markets was at an extreme and the fight against inflation was mostly over, which would eventually allow the Fed to back off the gas pedal with rate increases.
In our Market Update from October 25, 2022, we wrote, “When the short- and intermediate-term technical and sentiment indicators turned bullish two weeks ago, we increased equity exposure by 25% in the Smart Sector strategy. If our longer-term models also turn bullish [which they did on January 2, 2023], the remaining cash will get reinvested. If they remain risk-off and the internal (technical and sentiment) indicators return to a bearish signal, we will return to as much as a 50% cash allocation within the strategy. Overall, we continue to remain cautious and follow NDR’s first rule of research: ‘Don’t fight the Fed.’
“Given the technical and sentiment model improvement, we slightly increased our equity exposure during the market’s highly negative opening after the CPI report on October 13. Investors had become overly pessimistic, as indicated by the record amounts of put options (assets that appreciate in value as the underlying security’s price decreases) purchased towards the beginning of the month, retail investors’ high cash balances, survey data, and low dealer positioning. As Warren Buffet says, ‘Be greedy when others are fearful.’ If the aforementioned tailwinds should once again turn into headwinds, and the macroeconomic picture remains challenging, we will be quick to reduce equity exposure.” Our models did, in fact, continue to improve, and we went back to being overweight equities on January 2, 2023.
While performance in the fourth quarter of 2023 broadened out, much of the year saw equity markets being dragged higher by seven of the largest technology names (often referred to as the “Magnificent 7”). Roughly 70% of the S&P 500’s return last year was attributed to the Magnificent 7. The average return of those seven companies was +112%, while the average stock in the S&P 500 was up +15%. We should keep in mind that, even with last year’s gains, those seven stocks are only up about +8% total over the last two years, while the rest of the S&P 500 is up roughly +2%. While it is important to understand the past, our eyes are set on what’s next.
MACROECONOMIC VIEW
While analysts’ general consensus at the end of 2022 was a recession in the coming year, that expectation has now shifted to the Fed, which many believe has successfully navigated a “soft landing” for the economy. The U.S. economy has now seen 41 months of expansion, 36 consecutive months of non-farm payroll gains, real wages returning to positive growth, and a reported unemployment rate that ended the year at 3.7%. In addition, the earnings decline we saw in 2022 should largely be erased in 2023 after fourth-quarter numbers are reported in the coming weeks.
While many of these data points were a pleasant surprise based on expectations, they do not indicate that we are in a period of robust economic growth. According to NDR’s economic timing model, the U.S. economy is currently in a “slow growth” zone.
Figure 4: NDR Economic Timing Model
While the employment and wage gain reports have looked good on the surface, we are monitoring some points of potential weakness. Ten out of the last eleven months have seen downward revisions, and most new jobs created are government and service industry-related, which tend to be lower paying and less sticky. We have also seen a large uptick in people taking on second jobs, and the labor force participation rate is still not back to pre-pandemic levels. Also, although real wage growth is positive again, prices are up 17% over the last three years, so there is still quite a bit of catchup until buying power gets back to where it was. This could explain why we have recently seen some of the largest monthly increases in credit card debt on record. We are keeping an eye on this.
Figure 5: Revolving Consumer Credit Debt
VALUATIONS
After the most recent fourth-quarter rally, the average price-to-earnings (P/E) ratio for the S&P 500 is roughly 22.3X, historically above average. In addition, the P/E ratio for the Magnificent 7 is 34X, and all dividend-paying stocks are 14.6X. Valuations appear a bit higher than average when looking at forward earnings estimates, dividends, and cash flow. Below is a chart from NDR showing valuation yields. Equities are considered undervalued when yields are higher than average and overvalued when lower than average. They are currently lower than historical norms.
Figure 6: US Index Valuation Yields
TECHNICALS/SENTIMENT
We wrote in our last Market Update from September 29 of last year, “This type of market dynamic (just a handful of stocks driving broad index returns) can create performance anxiety for a lot of managers who are underperforming relative to their S&P 500 index benchmark. This underperformance has historically created demand as they try to catch up with the benchmark before year-end. Although the economic and monetary environments are less than favorable, the current pessimism evidenced by retail and institutional investors alike, along with FOMO (‘fear of missing out’) from managers who are underperforming their benchmarks, could be setting the markets up for a bullish fourth quarter this year. As always, we will follow the message of our models. They are keeping us bullish for now, but should they turn bearish, we will be quick to decrease risk across your portfolios.”
The pessimism we saw going into the fourth quarter of last year is now telling us the opposite story. This tends to happen after a +16% rally in the S&P 500 and a +26% rally in small-cap stocks (Russell 2000 index) over roughly two months’ time. According to Jeffries, Active Managers are now long equities at historically high levels. This has historically preceded periods of market pullbacks or consolidation.
Figure 7: NAAIM Exposure Index
The NDR Crowd Sentiment poll is also showing signs of “extreme optimism.” This indicator looks at an array of data points such as AAII market expectation surveys, put/call ratios, bullish versus bearish fund allocations, and a variety of other survey data. We use these types of indicators to try and determine when the crowd has reached an extreme.
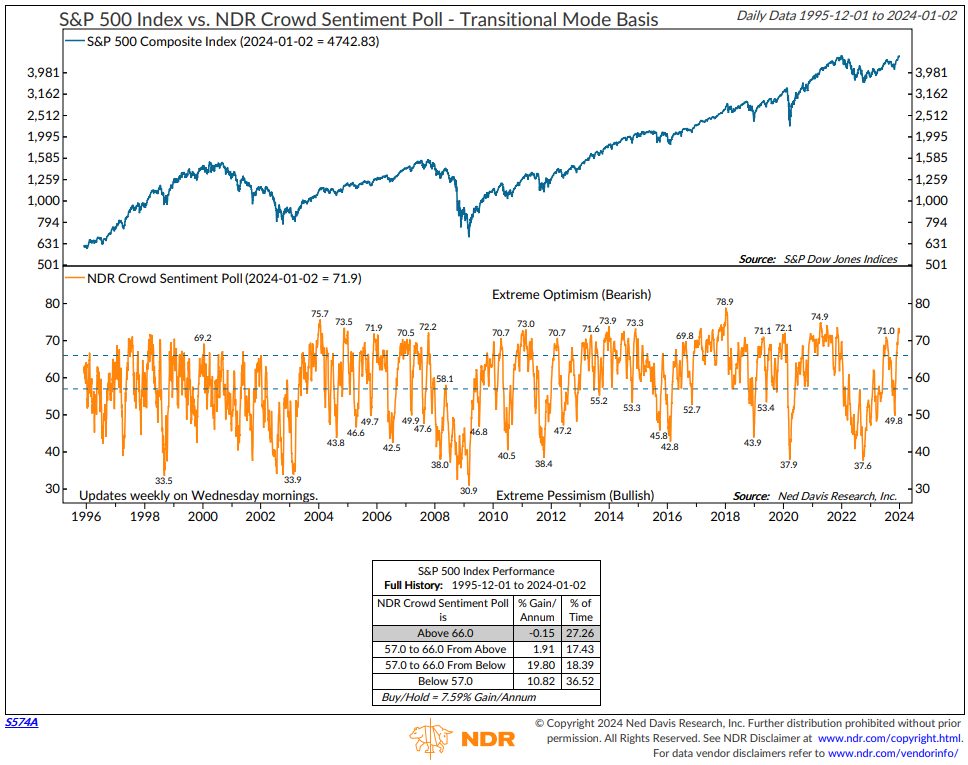
Figure 8: NDR Crowd Sentiment Poll
While the sentiment models are showing signs of extreme optimism, the technical underpinnings of the equity markets are still constructive. The NDR Big Mo Multi-Cap tape composite model analyzes over 100 trend and momentum indicators to gauge the technical health of the equity markets. While the market has pulled back slightly from its recent highs, the Tape Composite is still constructive on the intermediate-term technical health of the market.

Figure 9: NDR Big Mo Multi-Cap Tape Composite
We saw the fourth quarter rally we talked about as having a high probability of happening back at the end of September. The performance also broadened from only a handful of stocks doing well during the year’s first half to stocks more broadly participating in the dramatic fourth-quarter rally. We have seen some slight weakness in the first few days of the new year as markets reset after a robust end of the year. Sentiment and positioning have become on the excessively optimistic side, so some consolidation in the coming weeks is expected, but our models continue to show the equity markets to be constructive overall. That said, we are keeping an eye on the economic data and Fed speak as they both have the possibility to be a catalyst for extreme market moves. Currently, market participants are pricing in a +60% probability of the Fed cutting rates at their March meeting. This coincides with the Bank Term Funding Program, which was created in response to the “Regional Bank Crisis” early last year and is up for renewal. Throw in election season kicking into high gear, and we have a very interesting environment forthcoming. This is why we rely on our unemotional models to keep us from getting caught up in the emotion of investing. Currently, our models are showing signs of some possible consolidation in the near term but are still constructive on equities overall. Should that change, we will be quick to decrease risks across our portfolios.
As a housekeeping item, we like to use the turning of the calendar as a reason to re-address our client’s financial plans or to go through the financial planning process if you have not yet. We find that a sound financial plan brings peace of mind! Please use this link to schedule a meeting on a day and time that is convenient for you.
Have a great week,
Regan Teague, CFA®, CFP®
Senior Investment Officer & Financial Advisor
Day Hagan Private Wealth
—Written 01.08.2024
Natalie Brown, CFP®, Director of Client Services
Don Hagan, CFA®, Partner, Chief Investment Strategist
Art Day, Partner, Senior Portfolio Manager
Print PDF Copy of the Article: Day Hagan Private Wealth Market Update: Market Update January 9, 2024 (pdf)
Disclosure: The data and analysis contained herein are provided “as is” and without warranty of any kind, either express or implied. Day Hagan Private Wealth (DHPW), any of its affiliates or employees, or any third-party data provider, shall not have any liability for any loss sustained by anyone who has relied on the information contained in any Day Hagan Private Wealth literature or marketing materials. All opinions expressed herein are subject to change without notice, and you should always obtain current information and perform due diligence before investing. DHPW accounts that DHPW or its affiliated companies manage, or their respective shareholders, directors, officers and/or employees, may have long or short positions in the securities discussed herein and may purchase or sell such securities without notice. The securities mentioned in this document may not be eligible for sale in some states or countries, nor be suitable for all types of investors; their value and income they produce may fluctuate and/or be adversely affected by exchange rates, interest rates or other factors.
Investment advisory services offered through Donald L. Hagan, LLC, a SEC registered investment advisory firm. Accounts held at Raymond James and Associates, Inc. (member FINRA, SIPC) and Charles Schwab & Co., Inc. (member FINRA, SIPC). Day Hagan Asset Management and Day Hagan Private Wealth are both dbas of Donald L. Hagan, LLC.