MARKET UPDATE AUGUST 10, 2023
SUMMARY
After a brief pause, the Fed raised rates by another 25 bps in its latest policy announcement. The current level of Fed funds (5.25%-5.50%) has not been seen in 20+ years. The economic impact is yet to be felt fully, but we are already seeing signs that liquidity is shifting from being a tailwind to a headwind. Even with the increased risks posed by higher interest rates, however, the market trend remains positive and our models continue to keep us on the right side of the trend. Nonetheless, should our models deteriorate to a degree that justifies reducing risks, we will do so quickly.
BROAD MARKET PERFORMANCE (AS OF 08/07/2023)
| YTD Performance | Trailing 1-Year Performance | |
|---|---|---|
| SPY (SPDR S&P 500 ETF) | 18.75% | 10.80% |
| DIA (SPDR DJIA ETF) | 8.20% | 10.35% |
| QQQ (Nasdaq 100 ETF) | 41.31% | 17.44% |
| TLT (20+ Year US Treasury ETF) | -2.22% | -15.44% |
| AGG (US Agg Bond ETF) | 1.50% | -3.09% |
| Table 1: Source: Morningstar | ||
MACROECONOMIC VIEW
We are now almost 18 months (about one-and-a-half years) into the Fed’s rate hiking cycle, and it has increased the target rate’s range from 0.0%-0.25% in March of 2022 to 5.25%-5.5%. This has been the fastest hiking cycle in history. Moreover, the target rate is now at the highest level since March 2001.

Figure 1: Federal Funds Effective Target Rate Range
For most of this year, the bears and bulls have debated on whether the Fed will be able to navigate a “soft landing” as it tries to tame inflation (which is a nice way of saying “slow down the economy”). At the end of last year, many of the bears were calling for a recession to happen sometime in 2023, but that narrative has failed to materialize and many have thrown in the towel. One of the most famous bears, Morgan Stanley’s CIO Mike Wilson, has recently conceded he was wrong but with one small caveat: “Part of the reason we’ve found ourselves offside this year is that the fiscal impulse returned with a vengeance and remained quite strong in 2023—something we didn’t factor into our forecasts.”
We tend to agree with Mike’s assessment that government stimulus has provided ample liquidity for the economy for much longer than most predicted. It is one of the reasons our models turned bullish near the October 2022 lows. But the trend of higher liquidity is turning for consumers and businesses. According to a study published in May this year, the San Francisco Fed estimated there was still $500 billion on consumers’ balance sheets. That’s the good news. But it also estimated that the excess liquidity will be worked off by the fourth quarter of this year. In the chart below, you can see the historic spike in excess savings as consumers received personal stimulus checks and small businesses received loans and grants, while at the same time spending decreased as people were forced to stay home.
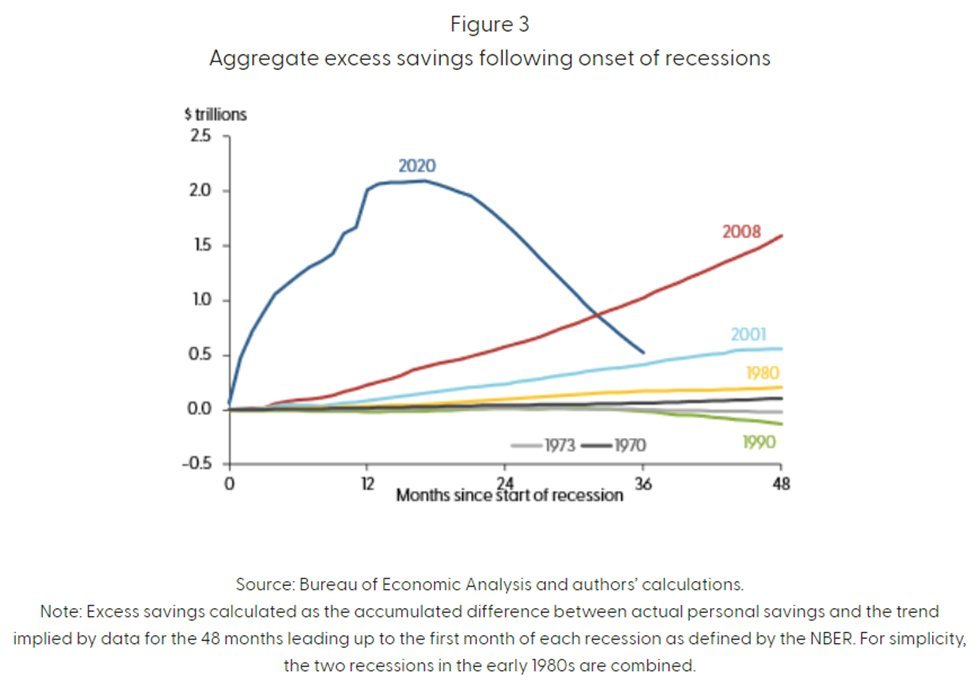
Figure 2: Aggregate excess savings following onset of recessions.
While the excess liquidity has propped up the economy for longer than most expected, we are seeing signs that liquidity is being drained. At the same time, the CPI (consumer price index), has improved by reversing from its peak, but it remains stubbornly high as the 3-month annualized rate stays twice as high as the pre-pandemic levels of 4.1%. In addition, we are seeing credit card balances start to increase and savings balances being drawn down. Bank of America recently reported that it saw a 36% YOY increase in hardship distributions among their four million 401K plan participants, indicating that consumers’ wallets are feeling the pressure. Our macroeconomic models are picking up on these weakening trends and are neutral overall.
TECHNICALS/SENTIMENT
While we are seeing some deterioration in recent economic releases, the equity markets continue to trade near historically high levels. Why the dichotomy? Early in the year, a small number of the heaviest-weighted stocks in the S&P 500 saw substantial gains while the rest of the market, by and large, wasn’t participating in the upmove to the same degree. That trend has shifted in recent months as the trailing 3-month return for the Russell 2000 Index, which has more stocks and is less top-heavy than the S&P 500, is +11.68% versus the S&P 500’s +9.64% gain. In July, three of the four sectors that outperformed were not technology related (Energy, Financials, and Materials).

Figure 3: S&P 500 Sector July 2023 Monthly Performance
While the path of least resistance has been higher for equities year to date, we note that optimism has increased to extreme levels. This condition has historically been a near-term headwind for stocks.

Figure 4: S&P 500 vs. NDR Daily Trading Sentiment Composite
Overall, we are of the opinion that fundamentals tell us what the market should be doing while technicals tell us what the market is actually doing. While we are seeing some deterioration in our external (fundamental/macro) models, the message of caution is being offset by the strong technical picture. Overall, the weight of the evidence continues to be bullish, but should our technical models reverse course, confirming the fundamental/macro trends, we will be quick to reduce risk across your portfolios.
Lastly, for all you Twitter (X) folks out there, make sure you follow us @DayHagan_Invest as we tweet indicator and model updates almost daily.
In the meantime, please don’t hesitate to reach out if you have any questions.
Have a great week,
Regan Teague, CFA®, CFP®
Senior Investment Officer & Financial Advisor
Day Hagan Private Wealth
—Written 8.8.2023
Natalie Brown, CFP®, Director of Client Services
Don Hagan, CFA®, Partner, Chief Investment Strategist
Art Day, Partner, Senior Portfolio Manager
Print PDF Copy of the Article: Day Hagan Private Wealth Market Update: Market Update August 10, 2023 (pdf)
Disclosure: The data and analysis contained herein are provided “as is” and without warranty of any kind, either express or implied. Day Hagan Private Wealth (DHPW), any of its affiliates or employees, or any third-party data provider, shall not have any liability for any loss sustained by anyone who has relied on the information contained in any Day Hagan Private Wealth literature or marketing materials. All opinions expressed herein are subject to change without notice, and you should always obtain current information and perform due diligence before investing. DHPW accounts that DHPW or its affiliated companies manage, or their respective shareholders, directors, officers and/or employees, may have long or short positions in the securities discussed herein and may purchase or sell such securities without notice. The securities mentioned in this document may not be eligible for sale in some states or countries, nor be suitable for all types of investors; their value and income they produce may fluctuate and/or be adversely affected by exchange rates, interest rates or other factors.
Investment advisory services offered through Donald L. Hagan, LLC, a SEC registered investment advisory firm. Accounts held at Raymond James and Associates, Inc. (member FINRA, SIPC) and Charles Schwab & Co., Inc. (member FINRA, SIPC). Day Hagan Asset Management and Day Hagan Private Wealth are both dbas of Donald L. Hagan, LLC.